We aim to promote sustainable developments on all stages of our value chain.
That is why we not only consider the impact of our own business activities but also address the ecological and social impact of our upstream supply chain. We also account for the downstream impact of our services and solutions on the environment and society.
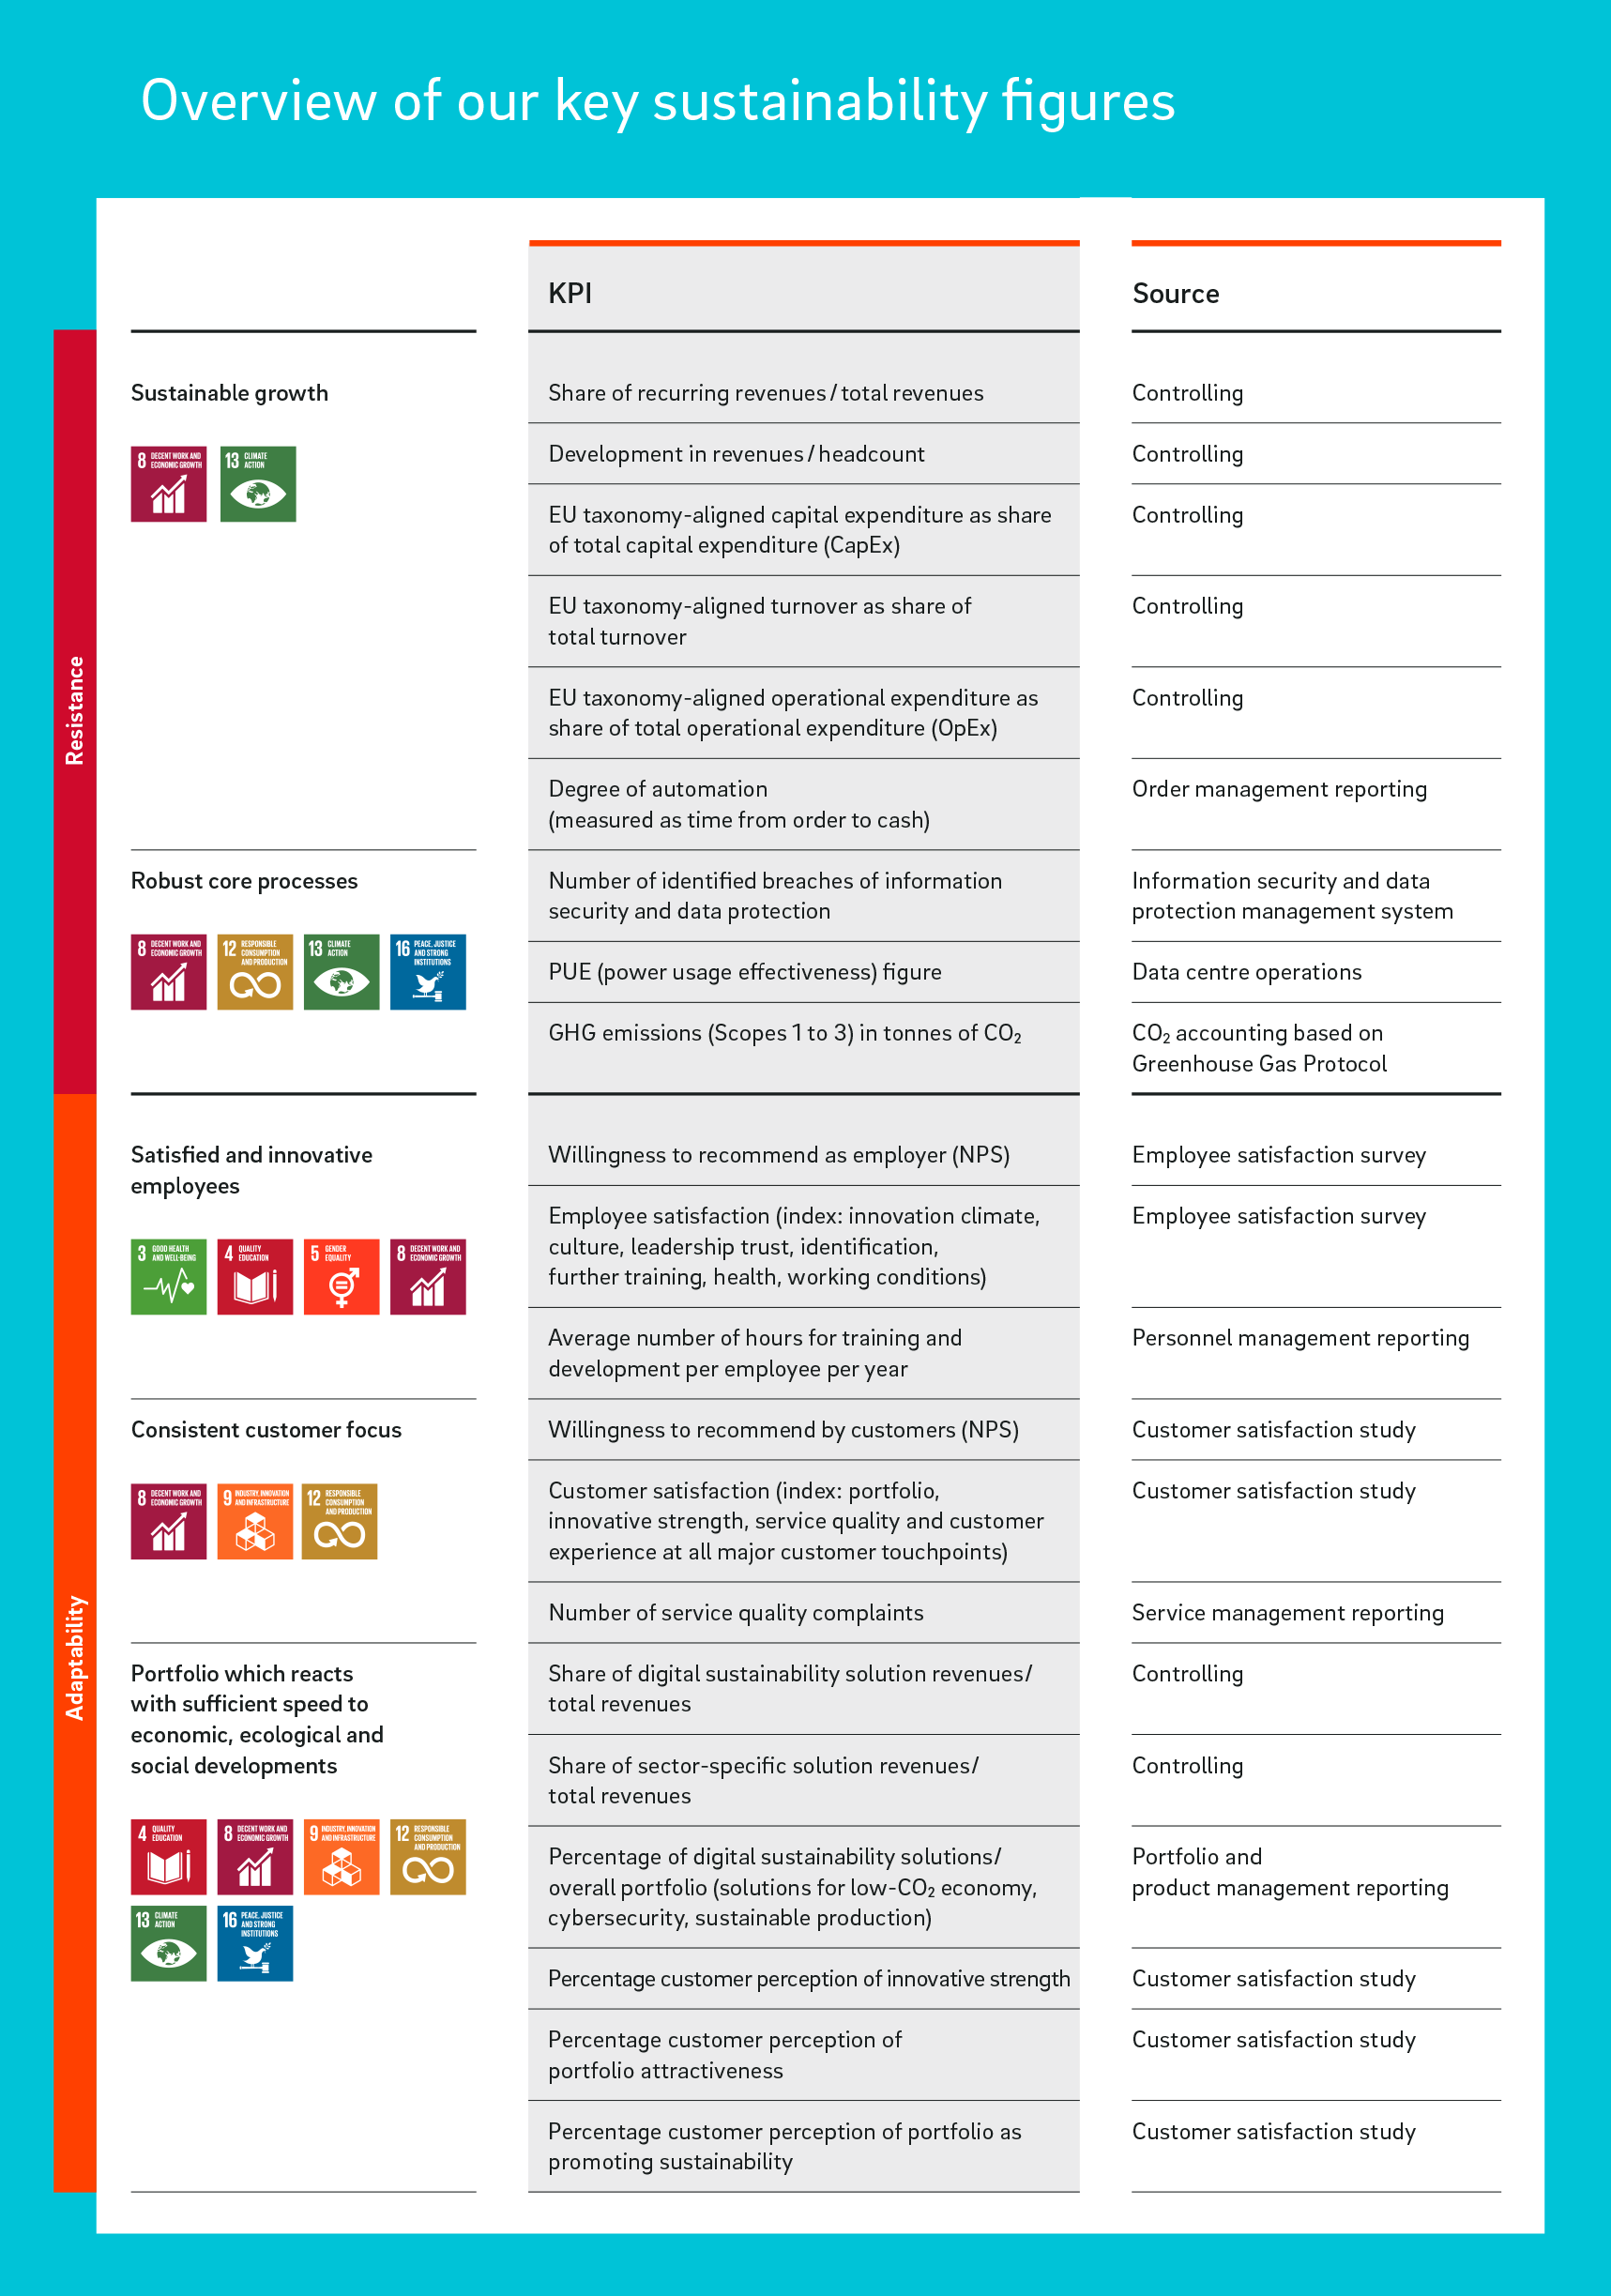
To factor sustainability into our daily work, we have established processes and control systems with non-financial key performance indicators.
Our value chain
We focus on the following factors throughout the value chain: information security and data protection, service reliability, innovation, service quality and a high degree of compliance and integrity.
How we measure our progress
-
Sustainable growth based on a high share of recurring revenues - Our company measures the progress made with our sustainable growth in particular by referring to the share of recurring revenues. In the past financial year, recurring revenues accounted for 76% of total revenues. This underlines the sustainability and resilience of our business model. A high degree of automation impacts on our profitability, as do efficient processes. Key indicators here include the length of time from receipt of the order through to receipt of the payment and the development of the “revenue per employee” key figure. In addition, we measure the shares of EU taxonomy-aligned revenues (turnover), capital expenditure (CapEx) and operational expenditure (OpEx) as a percentage of total turnover, CapEx and OpEx respectively. These key figures provide a good indication of the extent to which our business model promotes sustainability and of how closely our long-term development is aligned to the six environmental objectives pursued by the European Union.
-
Robust core processes are safe, energy-efficient and climate friendly - We monitor whether there have been any breaches of information security and data protection, how effectively our data centres use energy (“PUE” figure) and how large our ecological footprint is (GHG emissions).
-
Satisfied and innovative employees: first-hand information - Based on surveys, our People & Culture department determines how satisfied our employees are and how great their willingness is to recommend our company to others. We measure the latter aspect with the net promoter score (NPS) and thus based on the response to a single question: “How likely is it that you would recommend us as an employer to a friend?” Satisfaction levels are recorded by reference to various aspects including working conditions, further training, identification with the company and culture.
-
Consistent customer focus: recording actual satisfaction - We have regularly surveyed our customers for years now. Like with our employees, we record both the NPS and a wide range of topics which together provide information about the actual level of satisfaction. The questions refer to the portfolio, its degree of innovation, service quality and the customer experience along all touchpoints.
-
Rapid response capacity of portfolio: broad-based assessment - We refer to a broad range of key figures to record our progress in this area. These range from the share of revenues attributable to digital sustainability solutions through to customer perceptions of our innovative capacity and the contribution we make to their sustainability.
Our sustainability reports for download